Usability Insights: Crazy Egg
When I first heard about a tool called “Crazy Egg,” I thought maybe I’d logged into the wrong webinar. But when the presenter started talking about how she’d used Crazy Egg to make decisions about placing strategic content on their site, I perked up. By the end, I’d signed up for my own Crazy Egg account, and I’ve used it on many projects since. Read on to receive more usability insights and to find out why Crazy Egg should be in your box of tricks as well.
What is Crazy Egg, Anyway?
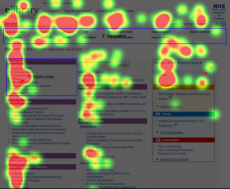
Known as a “poor man’s eye tracker,” Crazy Egg is a simple-to-use, Web-based tool that collects information on where customers click when they visit a Web page during a certain time period. Then it uses this data to create heat maps and other reports of usage patterns.
When Should I Use it?
There are many creative ways to use Crazy Egg. Most often, I find myself using it to:
- Help determine customers’ top tasks.
- Understand which pages draw first-time versus repeat customers.
- Get clues as to why people may not be converting.
- Test layouts or placement of important content.
For example, let’s say we’re redesigning a page and want to be sure customers click on a key link. First, I’d run a Crazy Egg test to see how many clicks the link received. Then I’d play with link placement and visual treatment, rerunning Crazy Egg tests between each change, until the link gets the traffic that we want.
Are There Drawbacks?
Of course, no tool is a magic bullet. When using Crazy Egg, be aware that:
- It can tell you what customers do on your site, but not why.
- You can’t easily test the whole site, so you may not see the full picture.
- Dynamic pages/page elements can be hard to interpret.
To account for its limitations, we often pair Crazy Egg with methods like usability testing, interviews, focus groups, and surveys to get a more complete understanding for customer behavior and motivations.
Analyzing Your Results
Crazy Egg offers five useful reports to help you dig into your data. I particularly like to use:
- The heat map to see an overview of where people click (photo above).
- The overlay for specifics on the clicks each element received; for example, percentage of traffic or segmentation by visitor for a particular page element.
- The confetti view to segment data by referral sources, new vs return visitors, and more.
While Crazy Egg is extremely easy to use, you may find that you get the most out of it if you work with a usability specialist to help choose and analyze the data. Contact TecEd for more usability insights or to start running your first study today!


